Most powerful feature of Veritak.
Trace Mode provides "Jump to Driver" in WaveformView.
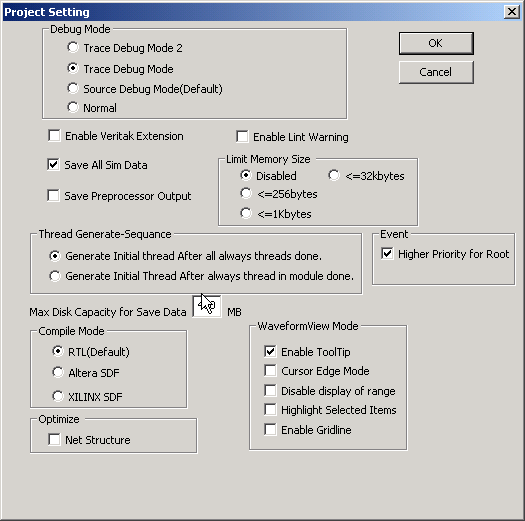
Before compilation Trace Debug Mode to be checked as below

Load Project "124test1.vtakprj"
Select [3:0] a, Right Click => Jump to Driver
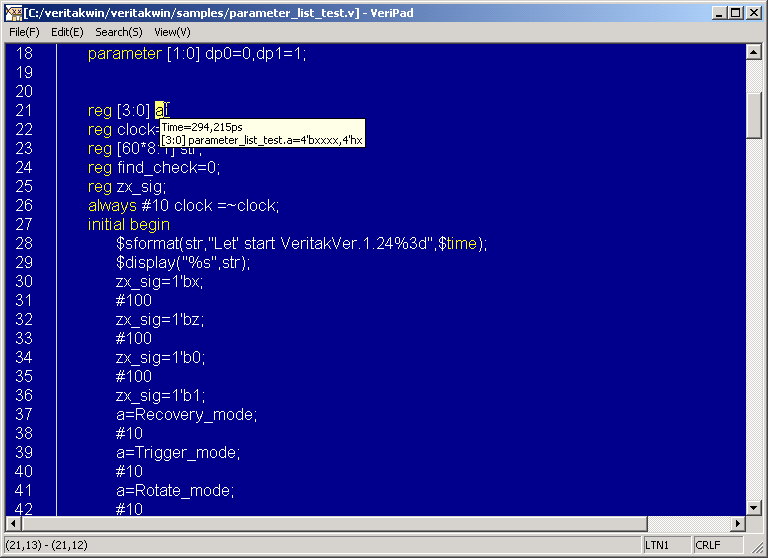
Then jump to the Driver at T1 Cursor Time.
But this is declaration, not driver, why?
Because [3:0] a has not been assigned by T1 cursor time (294215ps)
So, move T1 cursor slightly right.
Jump to Driver again.

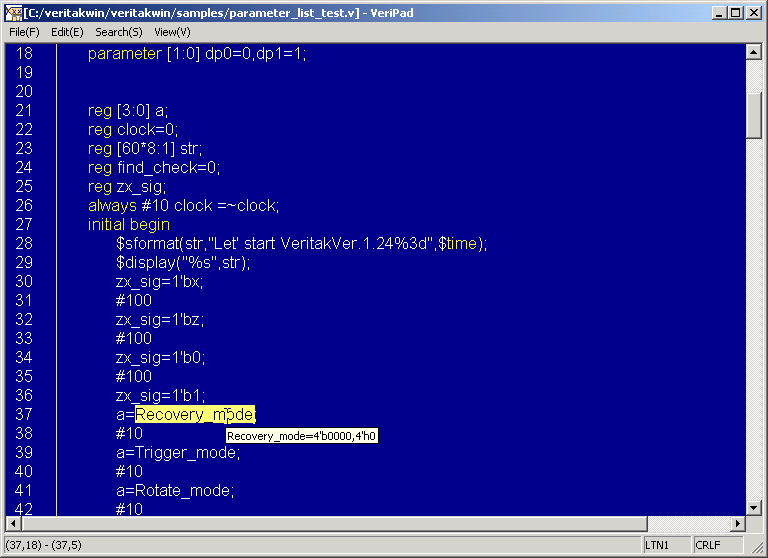
This time seems good.

Another example. Jump to Driver of " [480:1] str at T1 cursor.
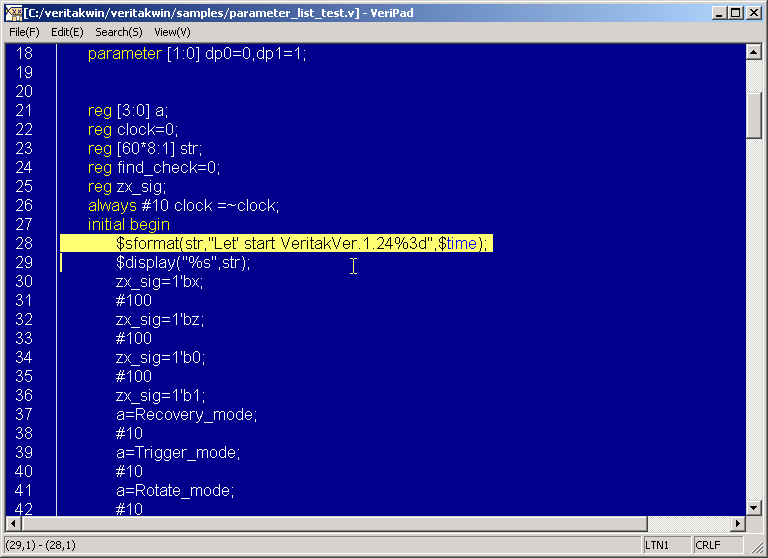
Seems good.
Multiple Destination
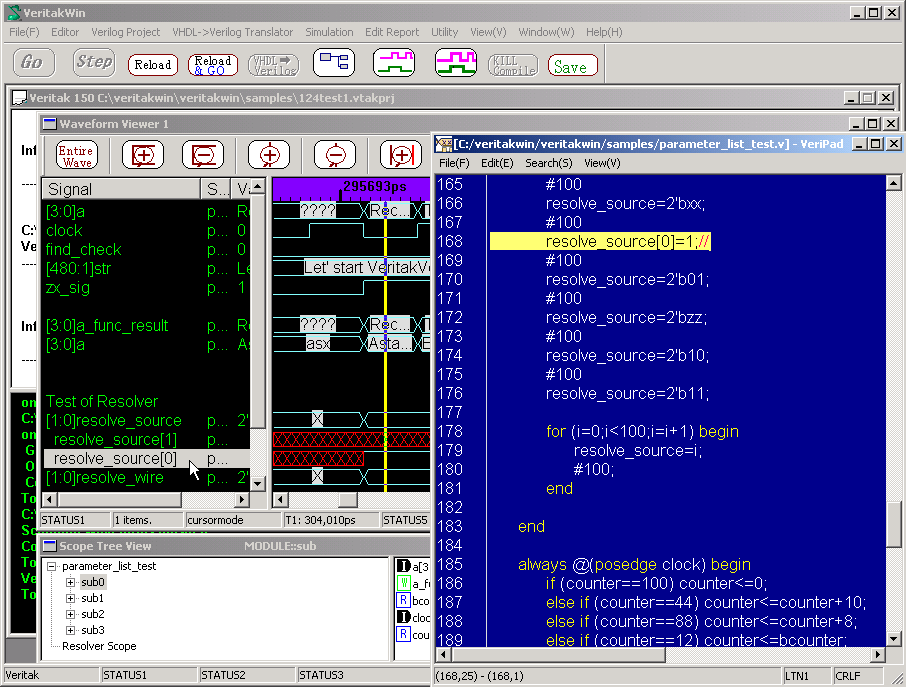
Try "[1:0] resolve_source".
Since the signal may have multiple destinations due to bit-select,
you are asked to expand the signal to bits. After bit-expanded, try resolve_source[0].
The operation results is below. Surely resolve_source[0] is assigned to
1.
Multiple Driver
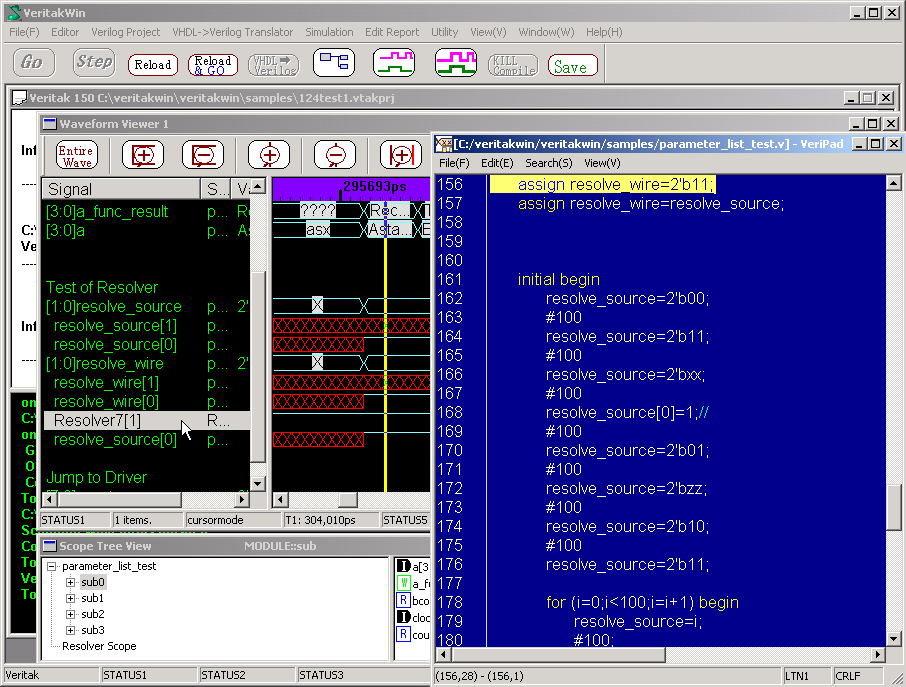
Try "[1:0] resolve_wire".
You will be asked twice. First is the same as above. Second is possibility
of multiple driver.
After Bit and resolver expansion, try Resolver7[1] and Resolve_source[0]

Second Driver is resolve_source[0].
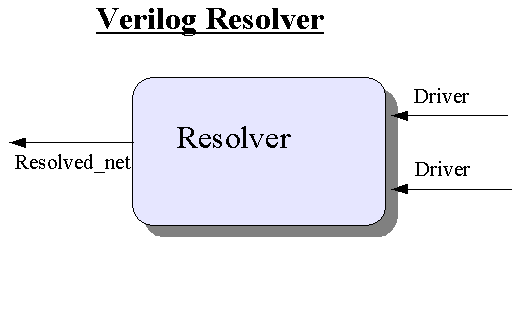
In Verilog-HDL multiple drivers are resolved as follows.
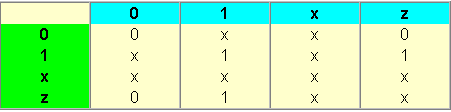
Resolver function table is below.(if strength is equal)
In this example constant 1 Driver and resolve_source[0] are input
of Resolver.
resolve_wire[0] is output of Resolver. Since both is 1 at T1 cursor time,resolve_wire[0]
becomes 1 from the table above.
Veritak trace mode provides function to display inputs for Resolver
Another Analysis example
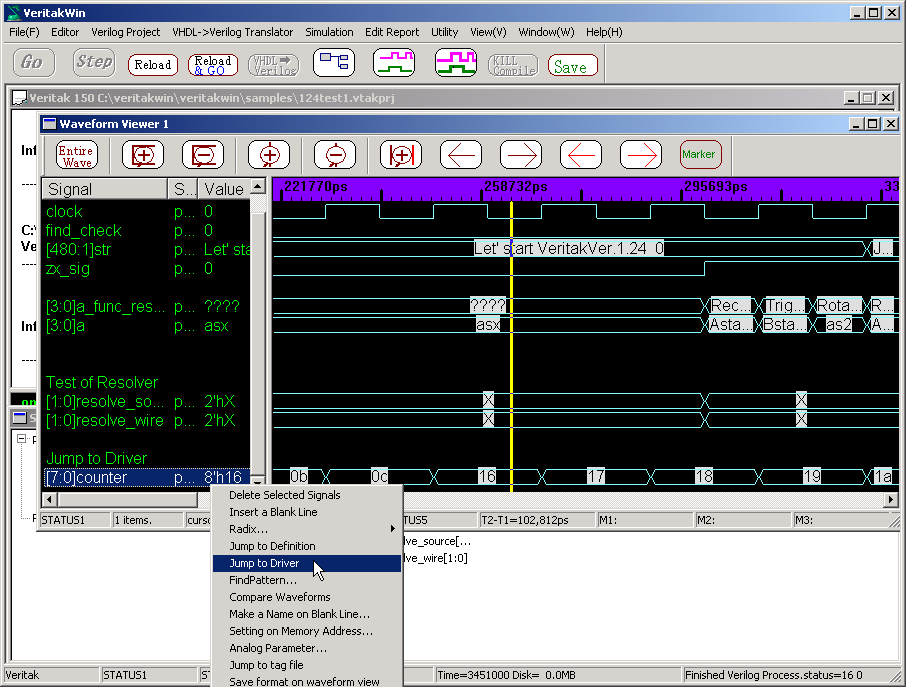
[7:0] counter value changes 8'h0c=>8'h16 as below.
Let's analyze why this jump occur.
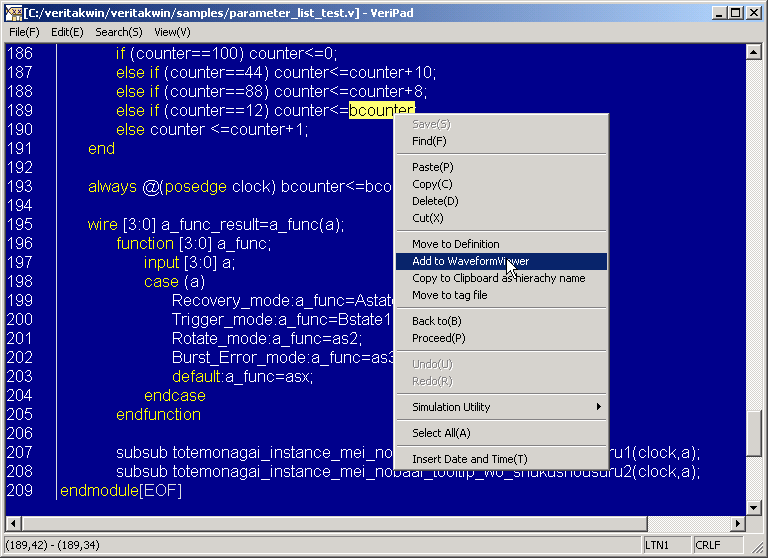

Jumped to Line 189.
Double -Click bcounter to display tool-tip.
At cursor time bcounter value is 8'h17.
We can not determine this is cause at this moment..
.
So, add "bcounter" to WaveformView.

By WaveformView, we realize that [7:0] counter jump was caused by loading [7:0] bcounter at line 189 Non-Blocking statement.
Trace Mode and Debug Mode summary
| source debug mode | trace mode | |
|---|---|---|
| Jump to Driver | Not available | Available |
| Editor tool tip | Only available when simulation engine is active(Blight Go button) Time is current simulation time. |
Always Available. Time is T1 time. If T1 is not displayed in WaveformView, no tool tip will be displayed. |
| Instance | Not associated width Scope Tree View. Instance is estimated by source file name and line no. Adding WaveformView means all possible instanced signals will be added. | Associated with Scope Tree View. Editor is assumed to be open under selected Scope Tree View. It is recommended to go to editor only by Scope Tree View or WaveformView. |
| Simulation Speed | 1 | 2-3 times slower |
| Memory Consumption | 1 | 2-3 times eats fat |
| SDF | Enabled | Disabled |
| Scope | No resolver Scope added | Resolver Scope added. This is internal use for Veritak. |
Tips:
An example using trace mode 1/2 can be shown in following link
.http://www.sugawara-systems.com/opencores/yacc/index.htm